Young Lives release new data visualizations
Young Lives have released the first in a series of new data visualizations that aim to make information from their comprehensive dataset on childhood poverty, created over the course of more than 15 years, accessible and interactive.
The visualizations seek to prompt discussion and reflection on what it is that impacts children in poverty and how they might best move from surviving to thriving in life.
Young Lives is an international study of childhood poverty following the lives of 12,000 children in Ethiopia, India (in the states of Andhra Pradesh and Telangana), Peru and Vietnam over 15 years. The research team is following two groups of children – a younger cohort born in 2001-02, and an older cohort born in 1994-95.
The visualizations have been developed around the themes of: Nutrition; Gender; Education; and Skills and Work and visualize snapshots and progressions across five rounds of household and child surveys conducted in the study (Round 1 in 2002; Round 2 in 2006; Round 3 in 2009; Round 4 in 2014; and Round 5 in 2016) for children from both cohorts.
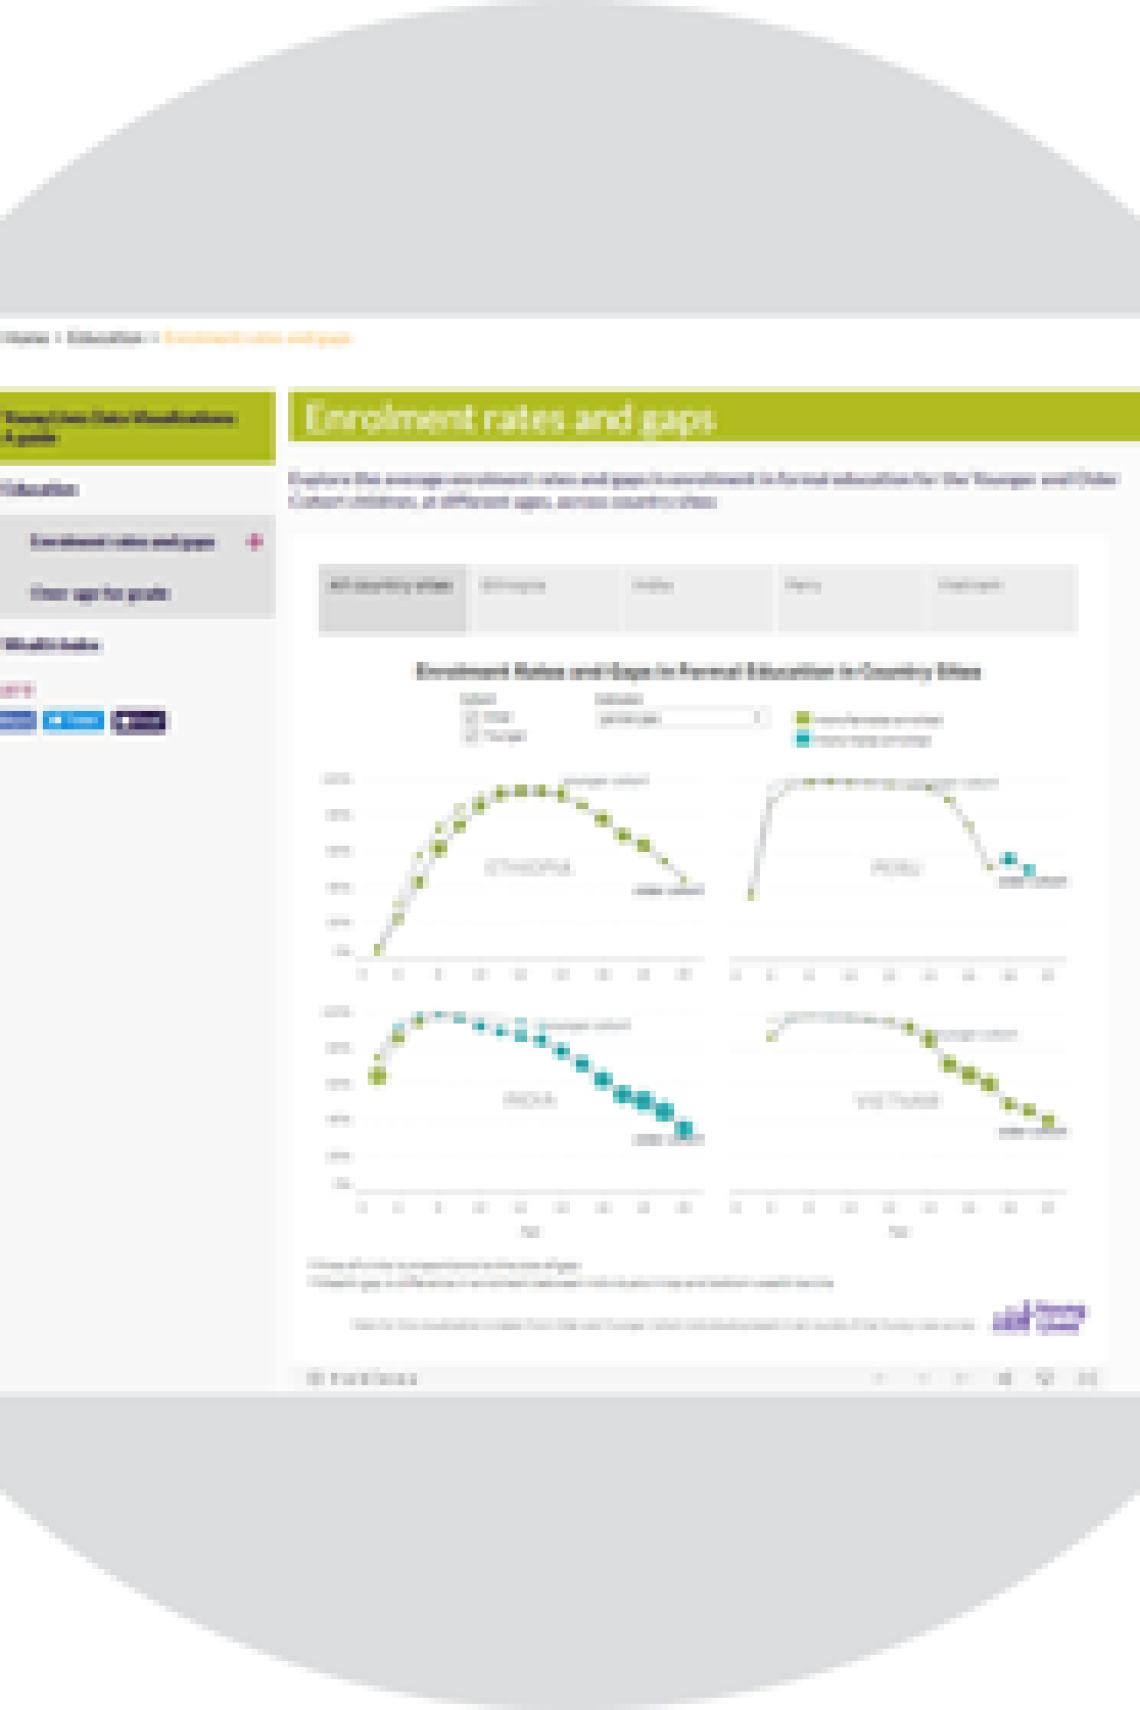
The first visualizations, released this week, explore education and wealth. Further visualizations will be released over the coming months.
These data visualizations do not cover the entirety of Young Lives data, but they offer an entry-point into the Young Lives work and key areas of focus, mapped against the global sustainable development agenda.